|
Smart layers are the quickest and most convenient way of retrieving the latest Census data for Winnipeg Health Region Neighborhoods, Clusters, Community Areas, Electoral Wards, as well as for the City of Winnipeg and the Winnipeg Health Region as a whole. These have been recently updated to include the 2016 Census data reports produced by the City of Winnipeg. How to Use Smart Layers: To use a Smart Layer, navigate to the legend in the Community Data Map for the Winnipeg Health Region, and click on the Smart Layer for the level of geography you are interested in (Smart Region, Smart Community Area, Smart Neighborhood Cluster, Smart Neighborhood, or Smart Electoral Ward). 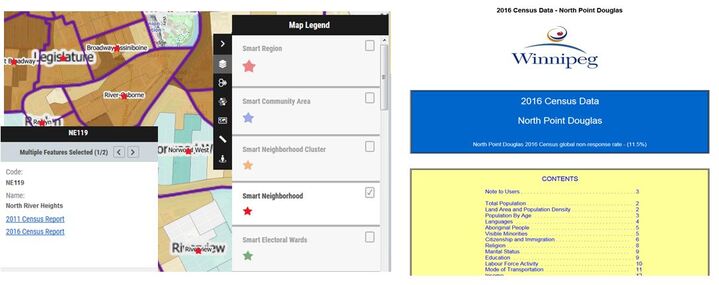 For example, when you click on the Smart Neighborhood layer, a red star will appear in the middle of each neighborhood (it is suggested that you first turn on the neighborhood boundary layer so you can see neighborhood names). Clicking on the red star for a particular neighborhood will launch the attribute pop-up box where you can then click on a hyperlink to the 2016 Census report produced by the City of Winnipeg. Links to earlier census reports are also available.
The Smart Region and Community Area layers also have links to the most recent Winnipeg Regional Health Authority Community Health Assessment reports and the 2012 Youth Health Survey Reports.
2 Comments
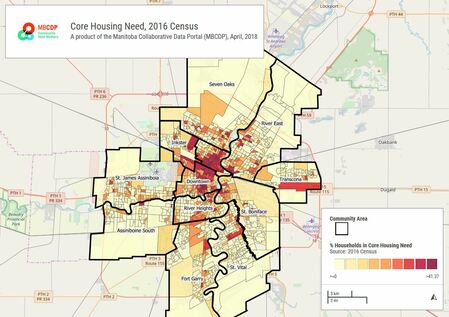
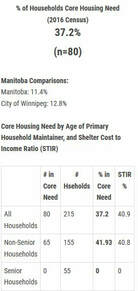
Over the last 2 months, we have added a number of detailed housing layers onto the portal. These provide information on core housing need and its components (% of households spending more than 30% on accommodation, housing suitability, major repairs required), housing type, ownership, and year of construction. The data has been added in two formats.
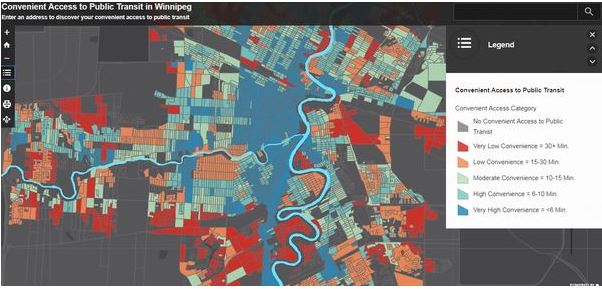
First, we have added 2 separate map layers into both the Winnipeg and Manitoba maps. These allow end-users to visualize using map overlays the % of households in core housing need and the % of households in unsuitable housing by small geographic area (dissemination area). By overlaying administrative boundaries of interest, one can quickly see the patterns of housing adequacy within and between neighborhoods, electoral districts etc. These layers are clickable so one can obtain detailed housing information for small geographies. Second, we have added the same data as a queriable layer that allows the extraction and sumarization of detailed housing data for any user defined area in Winnipeg or Manitoba. Using the query or proximity tool, one could for example, obtain detailed housing data for households living within 1 km of a school or community center, or alternatively housing data for 3 neighborhoods combined (e.g. West Broadway, Spence and St. Matthews combined). Click on the hyperlinks for instructions on how to use the query or proximity tools with the new housing layers, or watch the on-line videos we have posted on how to these tools ( videos 9, 10, and 11). 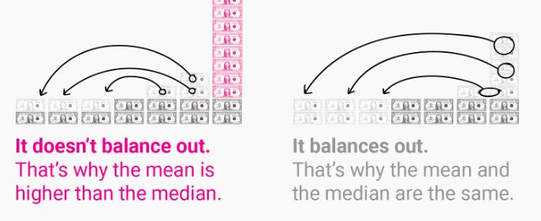 On our income maps in the MBCDP, both median and average household data are frequently presented. These terms can be confusing if you don’t know the difference between them, how they are calculated, and how to compare and use them.
Definitions:
Median household income is a more robust and accurate measure for summarizing income at the geographic level as compared to average household income since it is not affected by a small number of extremely high or low income outlier households.
Take a look at the article, What the difference between mean and median tells us about income inequality. This article provides concrete examples of how mean and median are calculated and how to interpret them.
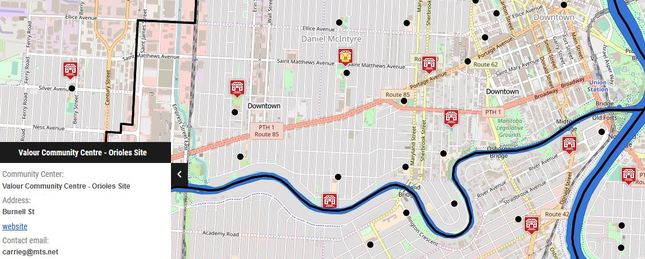 Community Center locations have now been added to the Winnipeg Map. The list of community centers was compiled by Martina Gornik-Marion, a Public Health Dietitian with the WRHA, and geocoded for mapping by Ryan Shirtliffe of the Institute of Urban Studies, University of Winnipeg. This layer contains Community Centers administered by the City of Winnipeg, the General Council of Winnipeg Community Centers (GCWCC) as well as a number of independently run community centers.
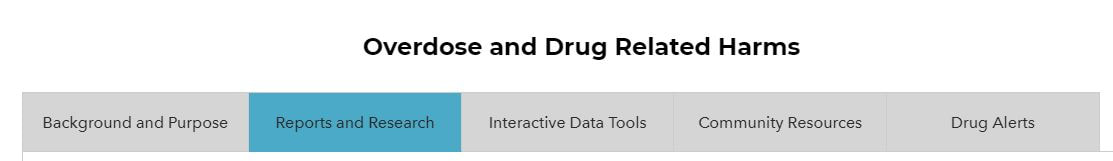 In August an Overdose and Drug Related Harms knowledge portal was launched. The purpose this portal is to provide an easily accessible knowledge base on Overdose and Drug Related Harms in order to engage and educate the public, and to inform policies and programs.
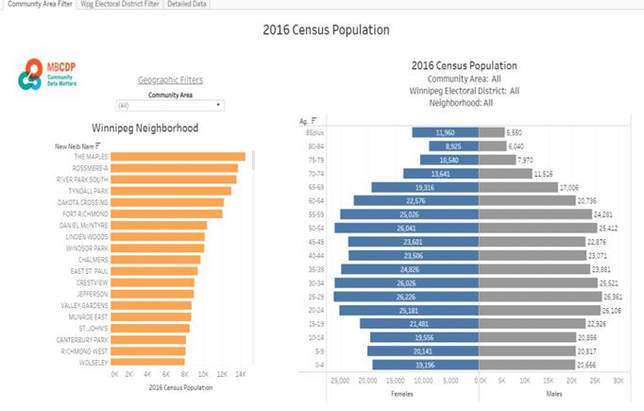
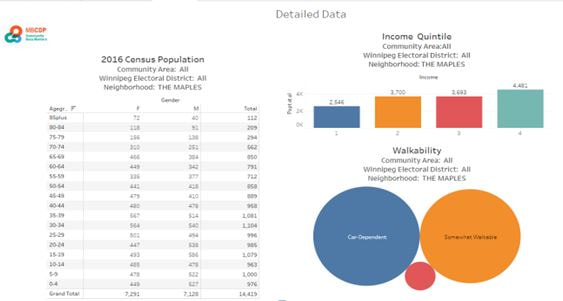
The portal contains links to relevant reports and research, an interactive mapping tool which illustrates where suspected drug overdoses are occurring in the Winnipeg Health Region, links to community resources, and a form where end-users can sign up for Street Connections drug alerts. The Manitoba Collaborative Data Portal is now building a solid user base. As shown in the chart below, there is an average of around 160-200 users accessing the portal every week, and this number is starting to increase. We are anticipating that the user-base will continue to increase as more people discover the portal and as we implement hands-on training sessions later the in the fall. 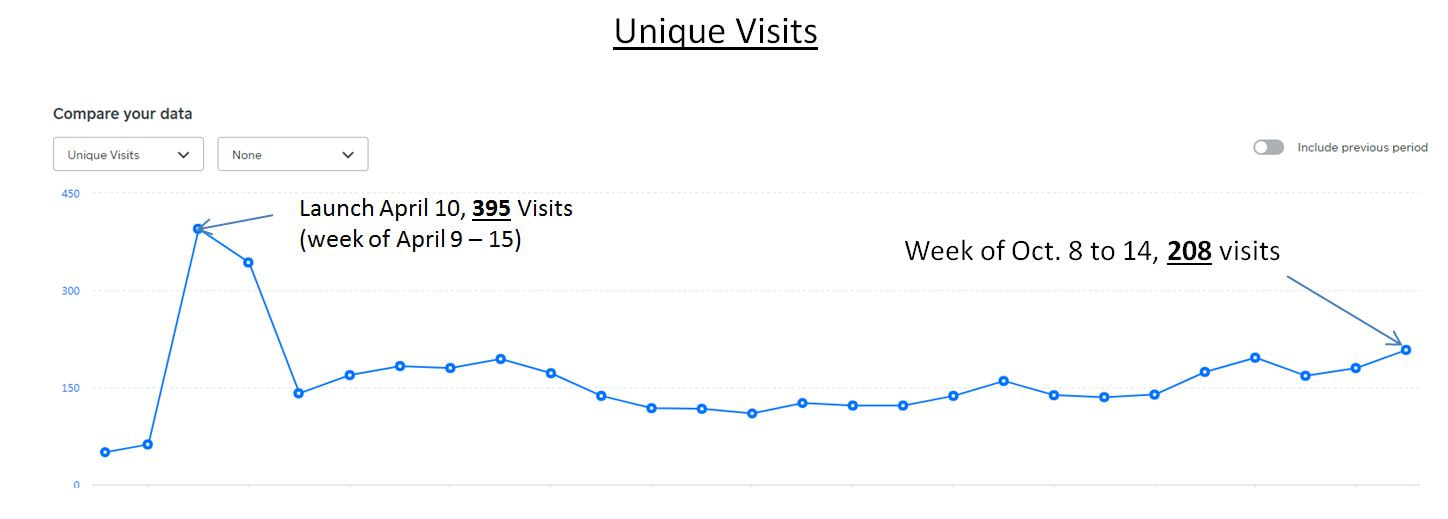 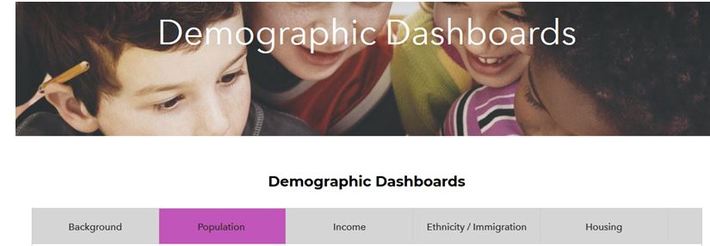 We are now adding a series of Demographic Dashboards to the Manitoba Collaborative Data Portal. These dashboards allow end-users to create visually appealing and detailed demographic profiles for both small and large geographic areas that can be exported as pdfs as well providing the capacity to export the underlying data. The initial dashboard which is now up and running provides detailed data on population size and age structure for the Winnipeg Health Region at the Community Area, Electoral District and Neighorhood levels. Population counts can be further broken down by both income quintile and neighborhood walkability. The data source is the 2016 Census. See below for sample outputs
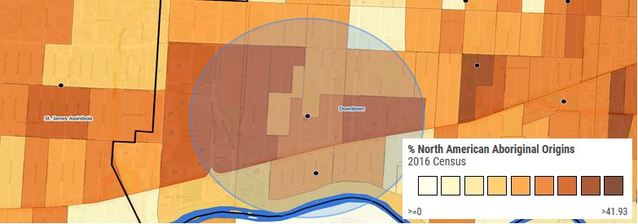 A queriable Census Ethnocultural Layer has now been added to both the Winnipeg and rural Manitoba maps. This layer allows the flexible extraction of data on the number of North American Aboriginals, Recent Immigrants and Visible Minorities using the Query and Proximity Tools. For example, one could user this layer to describe the ethnocultural characteristics of the population living within 2 kms of a school or community center, or alternatively in an Electoral Ward or Winnipeg neighborhood. See below for sample outputs from this layer when data is extracted using either the Query or Proximity tools. 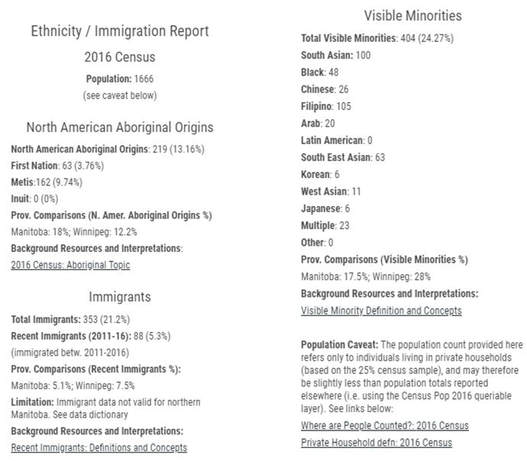 The Low Income dot layer on the Winnipeg Health Region map has been updated with data from the 2016 Census. This layer is based on the Low-income measure , after tax (LIM-AT) method for classifying individuals as living in low income households. A detailed definition of LIM-AT is available. (click on the hyperlink). The Low-income dot layer is a very effective tool for illustrating the location and magnitude of low-income populations in Winnipeg. Each dot represents 5 individuals, and the the different color dots represent different age ranges (0-5 yrs, 6-17 yrs, 18-64 yrs, 65 plus). As shown below, there are low-income individuals living in all parts of Winnipeg 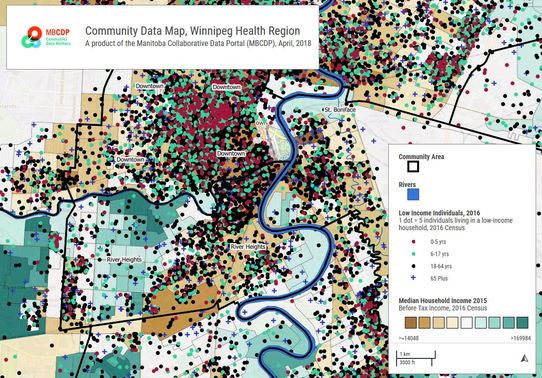 |
Archives
September 2019
Categories |
 RSS Feed
|
|
|