Demographic Dashboards
Background
Anyone who engages with their community needs to have detailed demographic information about that community. This is especially true of the health and social sectors - how could they possibly plan and deliver services and programs to their constituents if they know nothing about them?
To have maximum impact, programs and services need to take into account not only the size of the population and its age structure, but also a wide variety of other demographic characteristics including income levels, ethnicity, immigrant status, housing conditions and educational levels.
This section of the Manitoba Collaborative Data Portal uses as series of interactive dashboards to provide detailed demographic data about the Manitoba population. The information is derived primarily from the 2016 Census. These dashboards allow end-users to create visually appealing and detailed demographic profiles for both small and large geographic areas that can be exported as pdfs, as well providing the capacity to export the underlying data.
Within Winnipeg, for example, demographic profiles can be created at the 2018 Electoral District, Community Area and Neighborhood levels.
To know exactly which geographic areas you are selecting using these dashboards (i.e. neighborhoods, community areas) navigate to the Interactive Maps page to launch a web-map to view exact boundary locations.
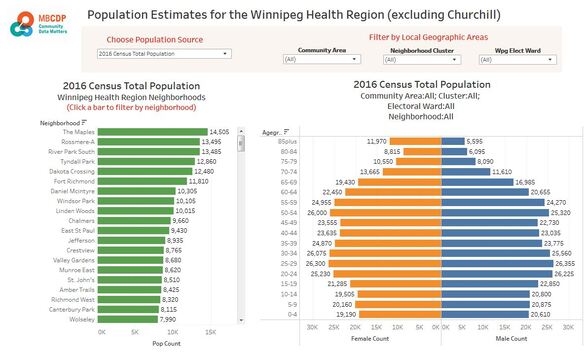
Population Estimates for the Winnipeg Health Region (excluding Churchill)
This dashboard provides detailed estimates of population size and age-structure at the Community Area, Neighborhood Cluster, Neighborhood, and Electoral District levels within the Winnipeg Health Region (excluding Churchill) by two different Census data sources and Manitoba Health Population Registry data. The Winnipeg Health Region includes the City of Winnipeg and the rural municipalities of East and West St. Paul. The two data sources are:
- 2016 Census Non-Institutionalized Population: 2016 Census estimates of the population living outside of institutional collective dwellings such as hospitals, nursing homes, penitentiaries and student residences
- 2016 Census Total Population: 2016 Census estimates for the total population, regardless of place of residence
- Manitoba Health Population Registry (for the years 1986, 1996, 206, 2016, 2017): Population estimates are based upon individuals who are registered with Manitoba Health to receive insured health benefits.
Be sure to review the data differences and limitations section below
Click on the image to launch the dashboard
How to Use the Dashboard:
1. Launch the Dashboard: Click on the image above to launch the Population Dashboard.
2. Choose the Population Source: Choose the population data source you want using the drop-down menu at top left of the dashboard.
3. View Detailed Neighborhood Specific Data: To view detailed information for a particular neighborhood, click on the neighborhood of interest in the left hand bar chart. When you do this, the population pyramid, the cross-tab table and the Dependency ratio will refresh to provide information specific to that neighborhood. To choose more than one neighborhood, hold down the Cntrl key and then click multiple neighborhoods. To clear a specific neighborhood selection, click the ESC key, or click in the white space within the neighborhood chart.
4. Filter by Community Area, Neighborhood Cluster, or Electoral Ward: To see only the sub-set of neighborhoods that fall into a particular Community Area, Neighborhood Cluster or Ward, you can filter the neighborhood bar chart using the geographic filters at the top right of the dashboard. To do this , click the down arrow in one of the selection boxes, unclick the ALL box, and then click on the geographic area(s) of interest. When you do this, the rest of the dashboard will refresh to reflect your selection criteria.
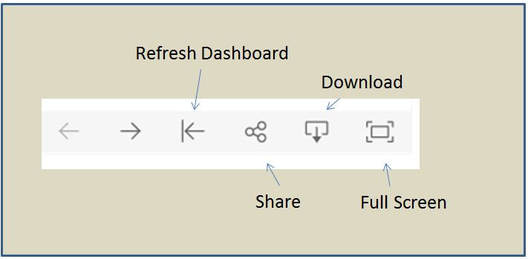
5. Clear Selections / Re-Set the Dashboard: To clear the geographic selections you have made and re-set the dashboard to its initial starting state, click on the Refresh Dashboard icon at the bottom of the screen (see image below).
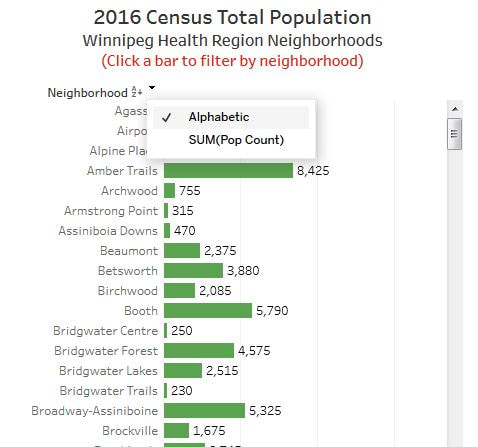
6. Sort Neighborhoods Alphabetically: To sort the neighborhoods alphabetically in the left-hand bar chart (instead of by the default population size), click on the small down-arrow beside the neighborhood label on the left hand bar chart (see the image below), and then click on the Alphabetic menu choice. Neighborhoods will now be sorted alphabetically. This can be helpful in finding a particular neighborhood.
1. Launch the Dashboard: Click on the image above to launch the Population Dashboard.
2. Choose the Population Source: Choose the population data source you want using the drop-down menu at top left of the dashboard.
3. View Detailed Neighborhood Specific Data: To view detailed information for a particular neighborhood, click on the neighborhood of interest in the left hand bar chart. When you do this, the population pyramid, the cross-tab table and the Dependency ratio will refresh to provide information specific to that neighborhood. To choose more than one neighborhood, hold down the Cntrl key and then click multiple neighborhoods. To clear a specific neighborhood selection, click the ESC key, or click in the white space within the neighborhood chart.
4. Filter by Community Area, Neighborhood Cluster, or Electoral Ward: To see only the sub-set of neighborhoods that fall into a particular Community Area, Neighborhood Cluster or Ward, you can filter the neighborhood bar chart using the geographic filters at the top right of the dashboard. To do this , click the down arrow in one of the selection boxes, unclick the ALL box, and then click on the geographic area(s) of interest. When you do this, the rest of the dashboard will refresh to reflect your selection criteria.
5. Clear Selections / Re-Set the Dashboard: To clear the geographic selections you have made and re-set the dashboard to its initial starting state, click on the Refresh Dashboard icon at the bottom of the screen (see image below).
6. Sort Neighborhoods Alphabetically: To sort the neighborhoods alphabetically in the left-hand bar chart (instead of by the default population size), click on the small down-arrow beside the neighborhood label on the left hand bar chart (see the image below), and then click on the Alphabetic menu choice. Neighborhoods will now be sorted alphabetically. This can be helpful in finding a particular neighborhood.
|
|
7. Export Images for Presentations: To export a high quality image of the dashboard click on the download icon at the bottom of screen and click either Image (for a .png file), PDF (for an Adobe Acrobat file) or Powerpoint (separate powerpoint slide for each dashboard object). Note that PDF and Powerpoint exported directly out of Tableau can be messy, and more reliable way of exporting the screen images is to use the Snipping Tool.
8. Export Data to Excel: To export the underlying data for a dashboard object (i.e. the pyramid chart, the cross-tab table), click on the dashboard object of interest (nothing will appear to happen), then click on the Download icon and choose Crosstab and then Download. This will result in a .csv file being downloaded to your computer that you can open with Excel.
8. Export Data to Excel: To export the underlying data for a dashboard object (i.e. the pyramid chart, the cross-tab table), click on the dashboard object of interest (nothing will appear to happen), then click on the Download icon and choose Crosstab and then Download. This will result in a .csv file being downloaded to your computer that you can open with Excel.
Data Differences and Limitations:
Reasons for Differences in Population Counts: These three sources give different estimates of population size and structure.
Reasons for Differences in Population Counts: These three sources give different estimates of population size and structure.
- The 2016 Census tends to under-count the total number of individuals because of non-response to the census. Non-institutionalized Census population estimates are even lower since they do not count individuals living in institutions. In comparision to the Manitoba Health Population Registry, the 2016 Census under-counts the overall population in the Winnipeg Health Region by approximately 6%. In some low-income neighborhoods, the population under count may be as great as 10%. See this article for a more precise explanation of why census under-counts occur.
- The Manitoba Health Population registry generally provides a larger and more complete population estimate than the Census. It is not a completely accurate source of population data however, since it depends upon individuals self-reporting when they have changed their place of residence and because some individuals may register their residence to a post-office box or residence not located where they live. This can result in population being allocated to non-residential and unpopulated areas such as industrial sites.
- Population counts are based upon current City of Winnipeg neighborhood definitions, with the exception that the newly established Guy Savoie residential development is included in the Transcona South neighborhood instead of St. Boniface Industrial Park.
- A number of individuals from the Manitoba Health Population Registry living in the Winnipeg Health Region could not be allocated with confidence to a Winnipeg neighborhood given the geographic information available and are labeled as “Unclassified”. These individuals can be excluded by unchecking the “Unclassified” box in any of the geographic filters.
- Individuals having a postal code associated with a Public Trustee or a Child and Family Services Agency are included in population counts (Manitoba Health Population Registry only), but can be excluded by unchecking the “PubTrustee/ChildFamServices” box in any of the geographic filters. Since the postal codes associated with these individuals are not their residence, these individuals are not allocated to a specific neighborhood.
- Population counts from the 2016 Census are randomly rounded to either the nearest 5 or 10
- Population counts under 10 from the Manitoba Population Health Registry are randomly rounded to the nearest 5.
Provincial Population Estimates:
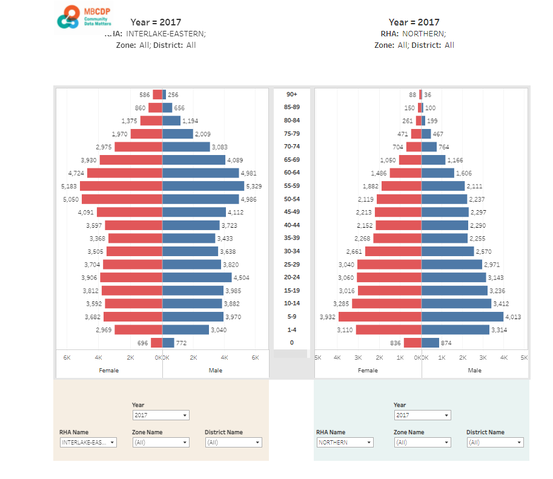
Population Counts, 20212 vs. 2017, by RHA, Zone and District
This dashboard uses Manitoba Health population registry data (a count of individuals registered with Manitoba Health to receive insured health benefits) to provide population counts at the Regional Health Authority (RHA), Zone and District levels in Manitoba for the years 2012 and 2017. Click on the image below the launch the dashboard.
Click on the image to launch the dashboard
Population Projections by RHA
This dashboard uses Manitoba Health population registry data to estimate projected population counts at the RHA level from 2017 to 2046, using an algorithm developed by Dr. Lisa Lix, University of Manitoba. Click on the image below to launch the dashboard.
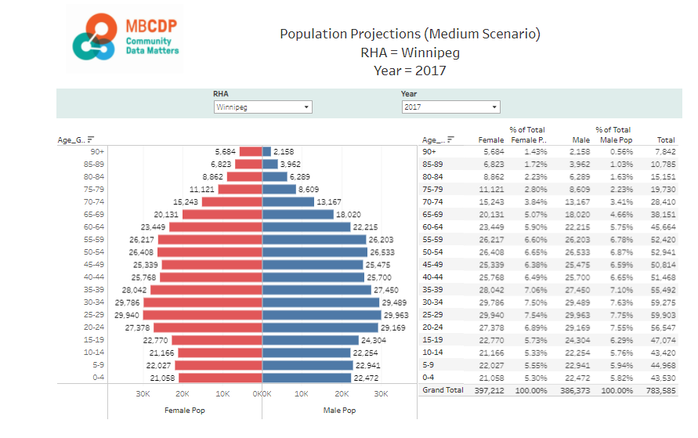
Click on the image to launch the dashboard