2019 Community Health Assessment
Overview:
|
The Community Health Assessment Portal is a suite of on-line data tools and links intended to supplement the PDF/paper-based 2019 Community Health Assessment Reports published by the five Regional Health Authorities in Manitoba in December 2019.
Community Health Assessment (CHA) reports provide baseline information about the health status, determinants of health and health system utilization of community residents. CHAs also track health outcomes over time, identify opportunities for health promotion and disease prevention, and describe the conditions that contribute to health disparities. For a detailed orientation to the CHA reports, watch the recent video overview Community Health Assessment Reports: Whats new and what it can mean for you. Developed collaboratively by the Population and Public Health Surveillance Unit and the Social Planning Council of Winnipeg, the Community Health Assessment Portal brings together a suite of web-based interactive data tools (dashboards and maps) as well as links to relevant reports to facilitate an exploration of key health trends and their structural determinants across the Winnipeg Health Region and Manitoba as a whole. Contact the Social Planning Council if you have any questions or comments on the portal. It is anticipated that the on-line tool-set hosted here will allow end users to explore and examine health indicators and trends in a flexible way; gaining powerful insight into data that matters for policy, planning, and decisions. Click on the Population Estimation Tools and the CHA Indicator Tools tabs above to access these tools. For quick access to a health indicator, use the Community Health Assessment Indicator Retrieval Tool (at right). |
Community Health Assessment Indicator Retrieval Tool
Use the Community Health Assessment Indicator Retrieval Tool to quickly search for and retrieve a health indicator from one of the 5 RHA 2019 Community Health Assessment reports, or to retrieve background technical data and results from 2019 RHA Indicator Atlas produced by the Manitoba Center for Health Policy. Click on the image below to launch the tool.
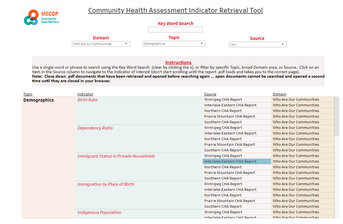
Click on the image to launch the tool
Health Equity Focus
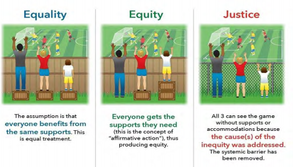
There is a strong focus in the 2019 Community Health Assessment reports on Health Equity. Whenever possible income or geographic disparity ratios have been calculated for each indicator as a measure of health equity. A comprehensive set of background resources on health equity can be found here. An excellent primer on health equity is the Winnipeg Regional Health Authority's original Health for All: Building Winnipeg's Health Equity Plan document.
|
Population Estimation Tools:
This section of the portal provides detailed population data for Manitoba and relevant sub-regions. Population data is the most critical piece of information required for planning programs and services across all jurisdictions. How many people there are, and how old or young they are has a huge impact on patterns of health and disease, the demand for health care services and social supports, the number of schools required, and the demand for housing of particular types. A population for example, that is very young with very few elderly members, will have relatively low levels of chronic disease such as diabetes, but will require a large number of schools; conversely, an older population with few young people, will have high levels of chronic disease, but a much lower need for schools.
Population Counts, 2012 vs. 2017 by RHA, Zone and District
This dashboard uses Manitoba Health population registry data (a count of individuals registered with Manitoba Health to receive insured health benefits) to provide population counts at the Regional Health Authority (RHA), Zone and District levels in Manitoba for the years 2012 and 2017. Click on the image below the launch the dashboard.
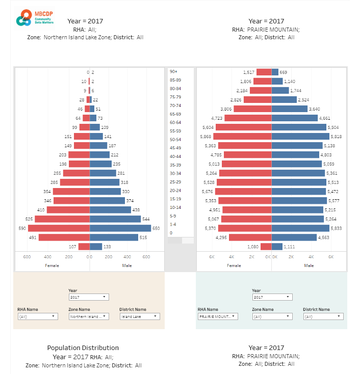
Click on the image to launch the dashboard
Population Projections by RHA
This dashboard uses Manitoba Health population registry data to estimate projected population counts at the RHA level from 2017 to 2046, using an algorithm developed by Dr. Lisa Lix, University of Manitoba. Click on the image below to launch the dashboard.
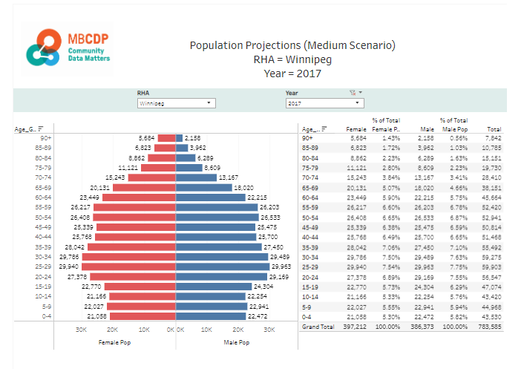
Click on the image to launch the dashboard
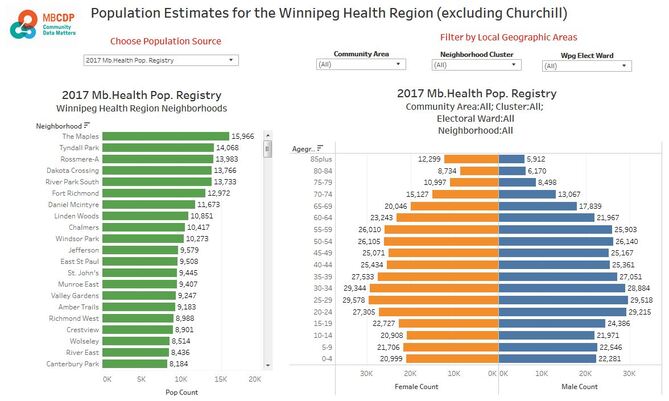
Population Estimates for the Winnipeg Health Region (excluding Churchill)
This dashboard provides detailed estimates of population size and age-structure at the Community Area, Neighborhood Cluster, Neighborhood, and Electoral District levels within the Winnipeg Health Region (excluding Churchill) by two different Census data sources and Manitoba Health Population Registry data. The Winnipeg Health Region includes the City of Winnipeg and the rural municipalities of East and West St. Paul. The two data sources are:
- 2016 Census Non-Institutionalized Population: 2016 Census estimates of the population living outside of institutional collective dwellings such as hospitals, nursing homes, penitentiaries and student residences
- 2016 Census Total Population: 2016 Census estimates for the total population, regardless of place of residence
- Manitoba Health Population Registry (for the years 1986, 1996, 206, 2016, 2017): Population estimates are based upon individuals who are registered with Manitoba Health to receive insured health benefits.
Click on the image to launch the dashboard
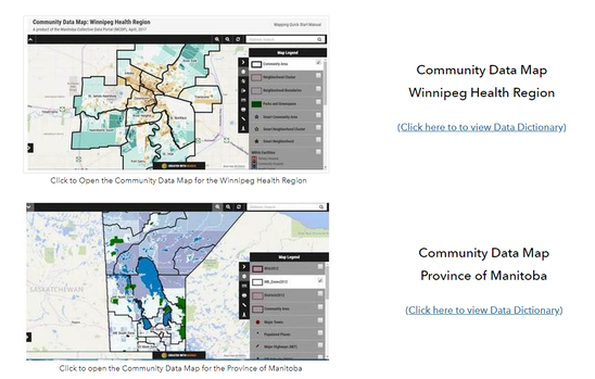
Small Area Population Estimates
Small area population estimates (derived from 2016 Census data) for user defined areas can be estimated using the Query Tool in the Winnipeg Health Region and Manitoba Maps. Also review the Video Tutorial (#9) which describes how to use the query tool to extract custom population data. Note: The 2016 Census data generally under-estimates the total population by about 3 -5% compared to data derived from the Manitoba Population Health Registry. Click on the image below to navigate to the community data maps (which can also be accessed under the Mapping and Dashboards menu drop-down).
CHA Indicator Tools
This section of the portal provides interactive data tools that allow rapid retrieval of CHA indicators, and access to an interactive tool set to dynamically explore indicators by person, time and place.
Community Health Assessment Indicator Retrieval Tool
Use the Community Health Assessment Indicator Retrieval Tool to quickly search for and retrieve a health indicator from one of the 5 RHA 2019 Community Health Assessment reports, or to retrieve background technical data and results from 2019 RHA Indicator Atlas produced by the Manitoba Center for Health Policy. Click on the image below to launch the tool.

Click on the image to launch the tool
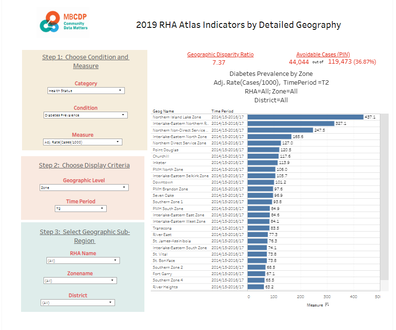
2019 RHA Atlas Indicators by Detailed Geography
The 2019 RHA Atlas Indicators by Detailed Geography Dashboard provides summary case counts and rates (crude, age, standardized) for a wide range of Health Status and Health Service Utilization indicators by RHA, Zone, and District (in the Winnipeg Health Region, Zones = Community Area; Districts = Neighborhood Cluster). For detailed instructions on how to use and interpret the dashboard, click on the button below. Information on the variables loaded into the dashboard (data source, method of calculation) and outputs from the 5 regional CHA reports that use these variables can be accessed via the Community Health Assessment Indicator Retrieval Tool. Click on the image below to launch the dashboard.
Click on the image below to launch the dashboard
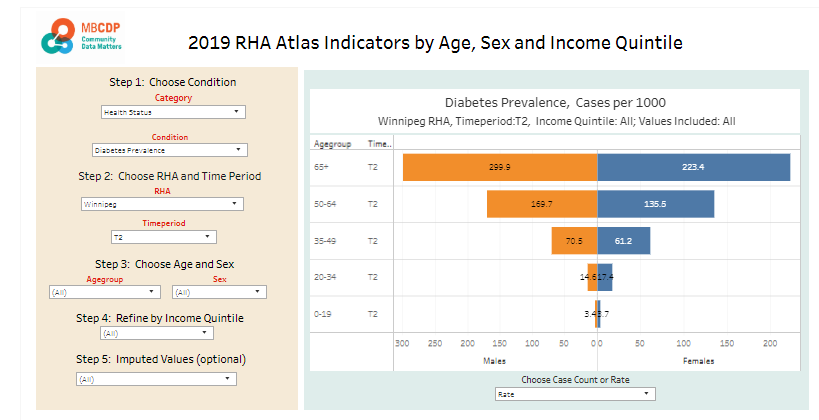
2019 RHA Atlas Indicators by Age, Sex, and Income Quintile
The 2019 RHA Atlas Indicators by Age, Sex and Income Quintile Dashboard allows the exploration of indicators by age, sex and income quintile at the RHA level. For detailed instructions on how to use and interpret the dashboard, click on the button below. Information on the variables loaded into the dashboard (data source, method of calculation) and outputs from the 5 regional CHA reports that use these variables can be accessed via the Community Health Assessment Retrieval Tool. Click on the image below to launch the dashboard.
Click on the image to launch the dashboard
2019 RHA Atlas Indicators, Rates and Cases Mapped by District
The 2019 RHA Atlas Indicators, Rates by and Cases Mapped by District Dashboard generates rate and dot maps at the district level in rural Manitoba and the neighborhood cluster in the Winnipeg Health Region. For detailed instructions on how to use and interpret the dashboard, click on the button below. Information on the variables loaded into the dashboard (data source, method of calculation) and outputs from the 5 regional CHA reports that use these variables can be accessed via the Community Health Assessment Retrieval Tool. Click on the image below to launch the dashboard.
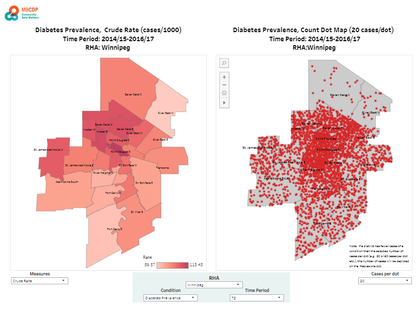
Click on the image to launch the dashboard
The Epidemiology of Communicable Diseases in the Winnipeg Health Region,
2013-2018
2013-2018
The 2019 CHA reports do not provide indicators on communicable diseases with the exception of sexually transmitted diseases and HIV. To fill that gap, this interactive tool developed Population and Public Health Surveillance (WRHA) provides information on the epidemiology of communicable diseases in the Winnipeg Health Region for the years 2013-2018. It provides a regional surveillance summary of select infections/diseases listed as reportable under The Manitoba Public Health Act. Click on the dashboard image below to launch the tool. Click on the report cover below to view a printable hard-copy report based on the same data.
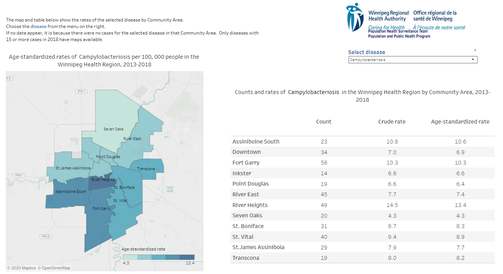
Click on the image to launch the dashboard
|
Click on the image to open the hard-copy report.
|
2019 CHA Reports
2014 and 2019 Community Assessment Reports
In the fall of 2019, the five Regional Health Authorities in Manitoba released their latest Community Health Assessment Reports. The most recent Community Health Assessment full reports for each of the five Regional Health Authorities in Manitoba are available at the links below:
In the fall of 2019, the five Regional Health Authorities in Manitoba released their latest Community Health Assessment Reports. The most recent Community Health Assessment full reports for each of the five Regional Health Authorities in Manitoba are available at the links below:
- Winnipeg Health Region:
- 2019 CHA report
- 2019 Community Area Profiles
- Assiniboine South (PDF, 2 MB)
- Downtown (PDF, 2 MB)
- Fort Garry (PDF, 2 MB)
- Inkster (PDF, 2 MB)
- Point Douglas (PDF, 2 MB)
- River East (PDF, 2 MB)
- River Heights (PDF, 2 MB)
- St. Boniface (PDF, 3 MB)
- St. James-Assiniboia (PDF, 2 MB)
- St. Vital (PDF, 2 MB)
- Seven Oaks (PDF, 2 MB)
- Transcona (PDF, 2 MB)
- Churchill (PDF, 936 KB)
- 2019 Community Area Profiles
- 2014 CHA report
- 2019 CHA report
- South Health Region:
- Prairie Mountain Health Region
- Interlake Eastern Health Region
- Northern Health Region