Instructions: 2019 RHA Atlas Indicators, Rates and Cases Mapped by District
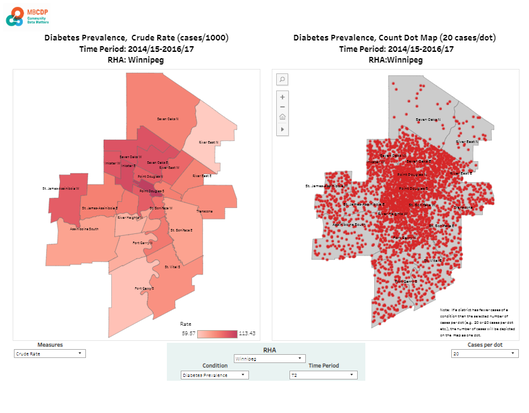
This dashboard allows an exploration of a wide range of health indicators using age standardized rate and dot maps. Rate maps are useful for identifying populations experiencing higher risk, while dot maps provide an indication of both where and how many cases are actually occurring. It is frequently the case that high rate rates geographic areas do not contain many cases, making rate maps less useful for planning service volumes and interventions. Indicator data were derived from the 2019 MCHP RHA Atlas data extras.
Note: This dashboard currently contain data on only 6 indicators, with more to come as time and resources permit.
Note: This dashboard currently contain data on only 6 indicators, with more to come as time and resources permit.
Setting up and Navigating the Dashboard :
Setting Filter Conditions:
Setting Filter Conditions:
- Condition: Choose the Indicator Condition of interest.
- Measure: Choose either Crude Rate or Age Adjusted Rate. This option will affect what is illustrated on the left hand map.
- RHA: Choose the Regional Health Authority of interest. Only the data for the RHA chosen will be illustrated on both the left and right hand maps.
- Time Period: Choose 1 or 2 time periods (T1, T2)
- Cases per Dot: Choose the number of cases each dot on the right hand map will represent. Note: If a district has fewer cases of a condition than the selected number of cases per dot, the number of cases will be depicted on the map as one dot.
- Map Zooming and Panning: Map views can be zoomed in and out using either the roller ball on the mouse, or by clicking on the Plus or Minus icons at the top left each map. To pan (move the map to the left/right, up/down), click and drag the mouse. The maps can be reset to their original extent by clicking on the House icon.
- Obtaining District Information: To obtain information about each district on the map (Name, Rate, Cases), hover the mouse pointer over the map.
Tableau Dashboard Instructions:
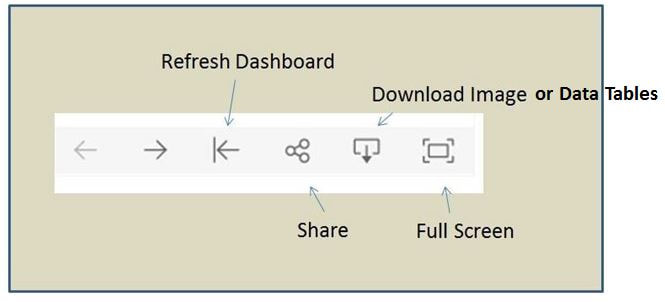
- Refreshing the Dashboard: The dashboard can be refreshed (taken back to its beginning state) by clicking on the Refresh button at the bottom right of the screen
- Viewing in Full Screen: To view the dashboard in full screen, click on the Full Screen icon at bottom right of the screen. When in full screen, you can return to the original view by clicking the ESC button.
- Exporting Images for Use in Reports: Images can be exported using one of four methods:
- Download the dashboard as a png file: Click on the download icon (see graphic below), and click on Image.
- Download the dashboard as a pdf: Click on the download icon, and then click on PDF
- Download the dashboard as a PowerPoint file: Click on the download icon and then click on Powerpoint
- Using the Snipping Tool in Windows to snip the portion of the dashboard you want to use in a presentation (this is the most reliable method)
- Exporting Data in Excel format:
- Click on the object of interest with your mouse (a graph or table)
- Click on the download icon and then click on Crosstab. This will export a copy of the data for that object in Excel format.