Instructions: Population Dashboards
Overview:
These dashboards facilitate the visualization and extraction of population data for a variety of geographic levels and years. Use the drop down menus in each dashboard to generate the population data of interest. Selection criteria are reflected in the titles of chart and table. See the Tableau Dashboard Instructions section below for tips on how to navigate the dashboards and to extract images and data from them. Detailed instructions on how to use the
Population Estimates for the Winnipeg Health Region dashboard can be found on the Demographic Dashboards page (click on the Population tab).
Tableau Dashboard Instructions:
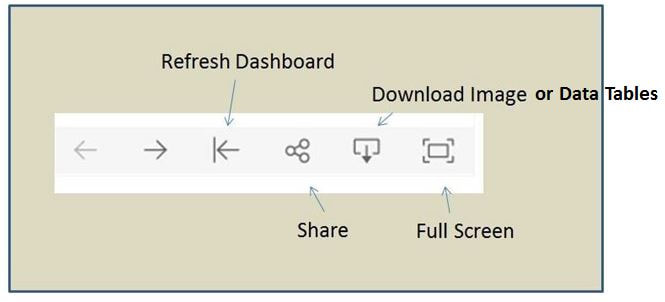
- Refreshing the Dashboard: The dashboard can be refreshed (taken back to its beginning state) by clicking on the Refresh button at the bottom right of the screen
- Viewing in Full Screen: To view the dashboard in full screen, click on the Full Screen icon at bottom right of the screen. When in full screen, you can return to the original view by clicking the ESC button.
- Exporting Images for Use in Reports: Images can be exported using one of four methods:
- Download the dashboard as a png file: Click on the download icon (see graphic below), and click on Image.
- Download the dashboard as a pdf: Click on the download icon, and then click on PDF
- Download the dashboard as a PowerPoint file: Click on the download icon and then click on Powerpoint
- Using the Snipping Tool in Windows to snip the portion of the dashboard you want to use in a presentation (this is the most reliable method)
- Exporting Data in Excel format:
- Click on the object of interest with your mouse (a graph or table)
- Click on the download icon and then click on Crosstab. This will export a copy of the data for that object in Excel format.