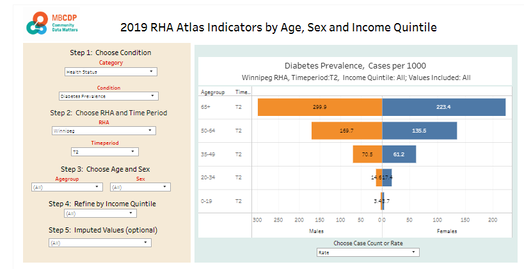
Instructions: 2019 RHA Atlas Indicators by Age, Sex, and Income Quintile
This dashboard allows to explore demographic trends (age, gender, income quintile) for a wide range of health indicators provided via the 2019 MCHP RHA Atlas data extras, As described below, the dashboard outputs can be refined using the filter drop-downs. This allows outputs to be portrayed by rates or counts, and refined by time periods, age group, gender, and income quintile.
Note: This dashboard currently contain data on only 6 indicators, with more to come as time and resources permit.
Note: This dashboard currently contain data on only 6 indicators, with more to come as time and resources permit.
Setting up the Dashboard Options for Analysis:
Category: Choose the indicator category of interest. Choices rae:
Case Count or Rate: Choose either Case Count or Rate. This option will affect what is illustrated (case count or rate) in the pyramid and bar charts, but do not affect the summary table.
RHA: Choose the Regional Health Authority of interest
Time Period: Choose 1 or 2 time periods (T1, T2)
Agegroup: Refine by agegroup if required
Sex: Refine by Sex if required
Income Quintile: Refine by income quintile if required. Note: Income quintile categories starting with "R" are rural income quintiles; those starting with "U" are urban (Winnipeg and Brandon). Income quintile categories are ordered from low income to high income (U1 is the lowest income, U5 is the highest income category).
Imputed Values: To protect confidentiality, the Manitoba Center for Health Policy suppressed any underlying table values less than 5. These values were imputed to ensure data completeness, but can be removed from the dashboard analysis by unclicking the imputed option.
Note: Please note that the rates portrayed in the Income Quintile chart are crude rates and have not been adjusted for age structure.
Category: Choose the indicator category of interest. Choices rae:
- Health Status
- Health Service Use
Case Count or Rate: Choose either Case Count or Rate. This option will affect what is illustrated (case count or rate) in the pyramid and bar charts, but do not affect the summary table.
RHA: Choose the Regional Health Authority of interest
Time Period: Choose 1 or 2 time periods (T1, T2)
Agegroup: Refine by agegroup if required
Sex: Refine by Sex if required
Income Quintile: Refine by income quintile if required. Note: Income quintile categories starting with "R" are rural income quintiles; those starting with "U" are urban (Winnipeg and Brandon). Income quintile categories are ordered from low income to high income (U1 is the lowest income, U5 is the highest income category).
Imputed Values: To protect confidentiality, the Manitoba Center for Health Policy suppressed any underlying table values less than 5. These values were imputed to ensure data completeness, but can be removed from the dashboard analysis by unclicking the imputed option.
Note: Please note that the rates portrayed in the Income Quintile chart are crude rates and have not been adjusted for age structure.
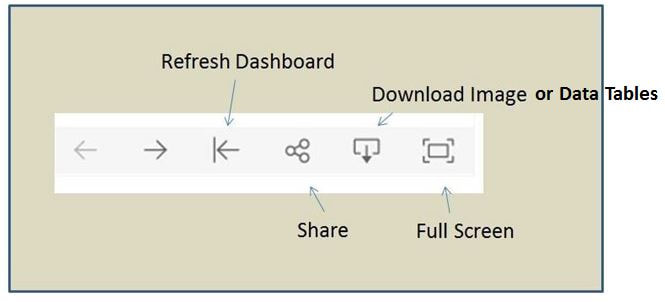
Tableau Dashboard Instructions:
- Refreshing the Dashboard: The dashboard can be refreshed (taken back to its beginning state) by clicking on the Refresh button at the bottom right of the screen
- Viewing in Full Screen: To view the dashboard in full screen, click on the Full Screen icon at bottom right of the screen. When in full screen, you can return to the original view by clicking the ESC button.
- Exporting Images for Use in Reports: Images can be exported using one of four methods:
- Download the dashboard as a png file: Click on the download icon (see graphic below), and click on Image.
- Download the dashboard as a pdf: Click on the download icon, and then click on PDF
- Download the dashboard as a PowerPoint file: Click on the download icon and then click on Powerpoint
- Using the Snipping Tool in Windows to snip the portion of the dashboard you want to use in a presentation (this is the most reliable method)
- Exporting Data in Excel format:
- Click on the object of interest with your mouse (a graph or table)
- Click on the download icon and then click on Crosstab. This will export a copy of the data for that object in Excel format.