Over the last 2 months, we have added a number of detailed housing layers onto the portal. These provide information on core housing need and its components (% of households spending more than 30% on accommodation, housing suitability, major repairs required), housing type, ownership, and year of construction. The data has been added in two formats.
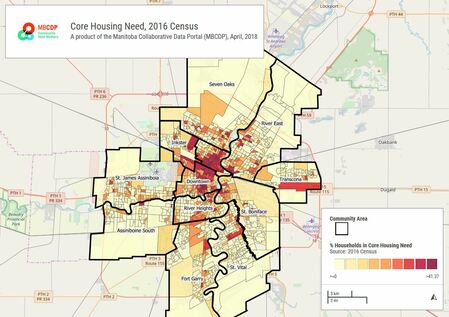
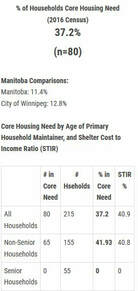
First, we have added 2 separate map layers into both the Winnipeg and Manitoba maps. These allow end-users to visualize using map overlays the % of households in core housing need and the % of households in unsuitable housing by small geographic area (dissemination area). By overlaying administrative boundaries of interest, one can quickly see the patterns of housing adequacy within and between neighborhoods, electoral districts etc. These layers are clickable so one can obtain detailed housing information for small geographies. Second, we have added the same data as a queriable layer that allows the extraction and sumarization of detailed housing data for any user defined area in Winnipeg or Manitoba. Using the query or proximity tool, one could for example, obtain detailed housing data for households living within 1 km of a school or community center, or alternatively housing data for 3 neighborhoods combined (e.g. West Broadway, Spence and St. Matthews combined). Click on the hyperlinks for instructions on how to use the query or proximity tools with the new housing layers, or watch the on-line videos we have posted on how to these tools ( videos 9, 10, and 11).
0 Comments
|
Archives
September 2019
Categories |
 RSS Feed
|
|
|