Tutorial Resources - Winnipeg Food Atlas
Using the Interactive Food Atlas Map
Check out the On-line Tutorials for Mango Map:
Load the Interactive Map:
- The interactive map was built using an on-line product called Mango Maps. We have created a series of User Manuals and Video Tutorials which describe in detail how to use Mango maps. We have also produced a Quick Start Guide. We would suggest that you check these out in advance before using the mapping tool, or to refer to these if you get stuck.
Load the Interactive Map:
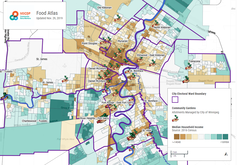
- Click on the Interactive Map image to load it.
- When the map opens, two layers or turn on by default. These are Median Household Income (2016 Census) and the location of Community Gardens.
|
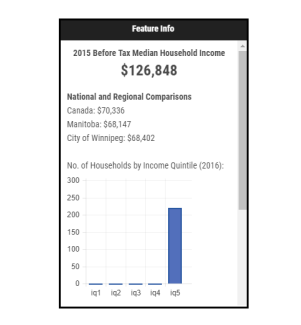
Click a Map Layer to Obtain Additional Information about Food Assets or Population Characteristics:
|
|
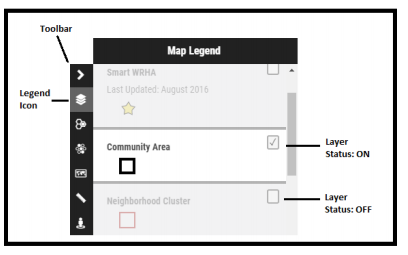
Turn Layers On/Off:
|
|
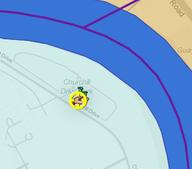
Navigating Around the Map
|
|
Searching the Map:
|
|
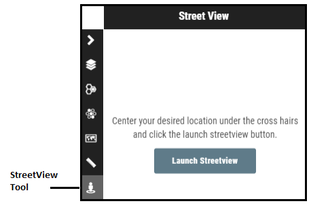
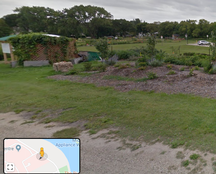
Investigating What's on the Ground (e.g. a Community Garden Location) Using Google Streetview:
|
|
Print / Export High Quality Map Outputs:
|
|
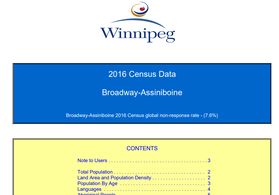
Get Detailed Census Data for Neighborhoods or Wards:
|
|
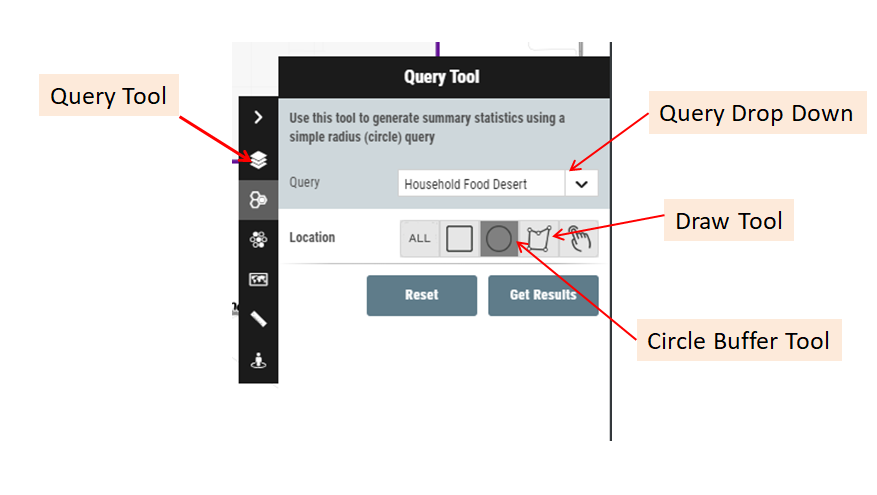
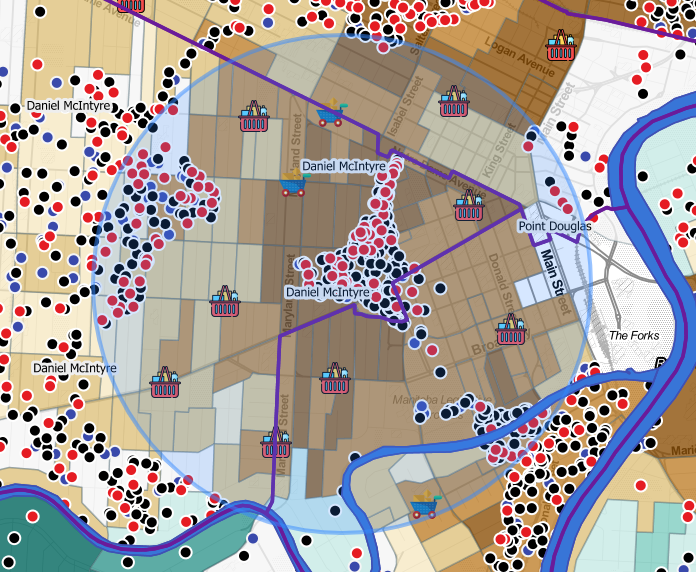
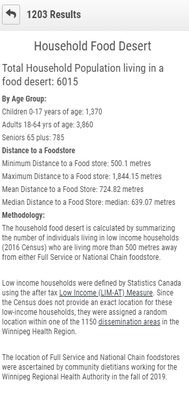
Count the Number of Individuals Living in Household Food Deserts:
|
|
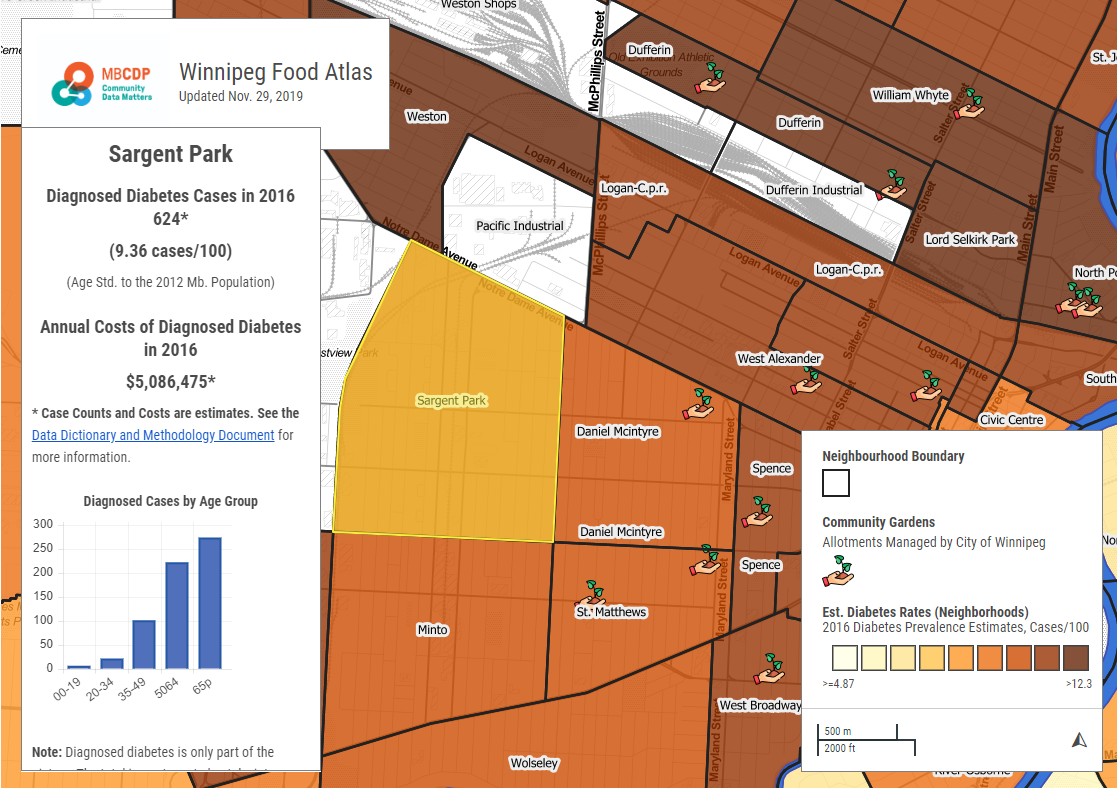
Explore Nutrition Insecurity by Investigating Estimated Diabetes Cases and Costs at the Neighborhood or Ward levels:
|
