Manitoba Collaborative Data Portal
  • Home
  • Mapping + Dashboards
    • Demographic Dashboards
    • Web Mapping === >
      • Interactive Web Maps
      • Data Dictionary
      • Queriable Layers
      • User Manuals
      • Video Tutorials
    • WHR Client Lookup
    • Map Gallery
  • Knowledge Portals
    • Food and Nutrition Security
    • Transportation and Urban Design
    • Housing and Homelessness
    • Overdose and Drug Related Harms
    • Community Health Assessment 2019
  • Resources
    • Local Data Portals
    • National Data Portals
    • Training Resources
    • Manitoba Census Data Consortium === >
      • About
      • Private Access
    • Neighborhood Explorer Toolset
    • Update History
  • Help
    • About MbCDP
    • Getting Started
    • FAQs
    • Blog
    • Sign Up for Updates
    • Contact

Instructions
Query and Proximity Tools for Housing Data 

Instructions:  Query and Proximity Tools for Housing Data 

You can use the Query and Proximity Tools to extract housing data from the maps using either standard geographic areas of interest or a user defined area.  These tools extract data from a queriable housing layer that is not visible on the map (see the description of queriable layers, how they are constructed, and the other queriable layers that can be used with the query and proximity tools).   

 Here are two worked examples which will show you how to use these tools: 
Example 1:   Using the Query Tool to extract housing data within a 1 km buffer of  Gordon Bell High School: 
Steps: 
  1. Open up the Winnipeg Community Map
  2. Turn on the school layer and navigate to Gordon Bell High School (or any school). 
  3. Click on the Query Tool
  4. Choose the "Census Housing 2016" layer in the query layer picklist
  5. Click on the circular buffer tool, click and drag a 1 km buffer around  the school and release
  6. Click on the Get Results button, and then on Generate Report  
  7. A detailed housing report will then be generated 
Picture
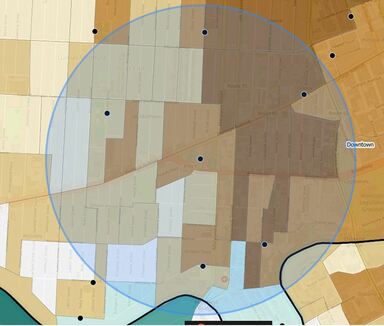
Step 5: Click on the circular buffer tool, click and drag a 1 km buffer around the school, and then release
Picture
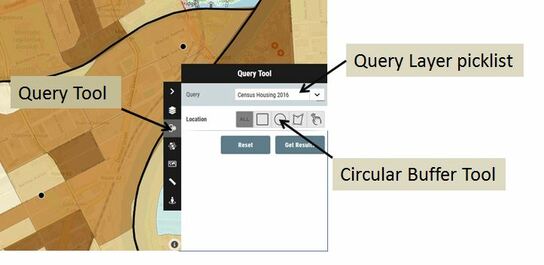
Steps 3: Click on the Query Tool. Step 4: Choose the Census Housing 2016 layer in the query layer picklist
Picture
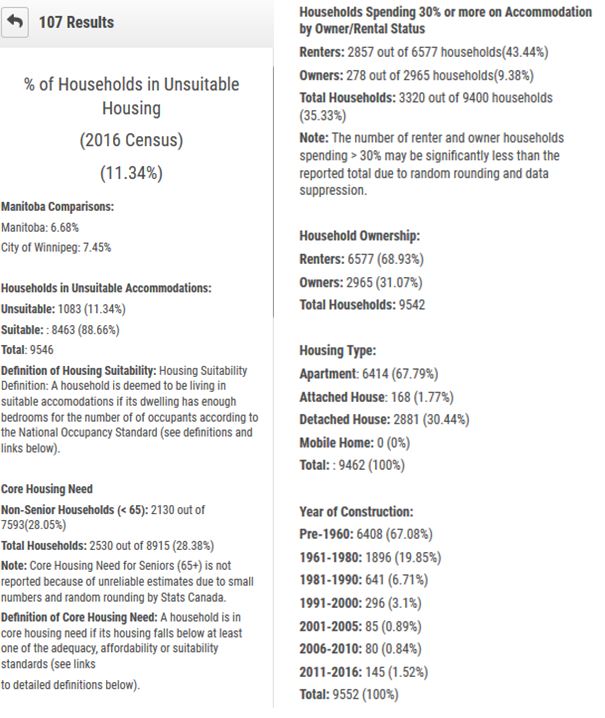
Step 7: Report Generation

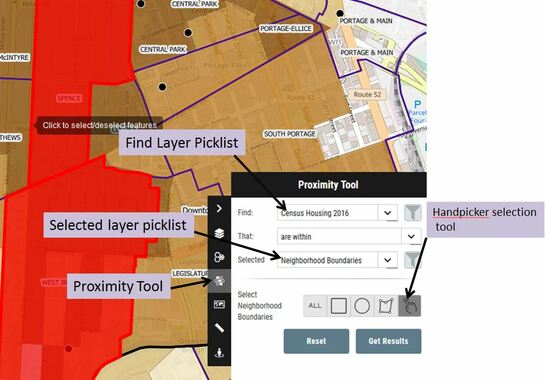
​Example 2:  Using the Proximity Tool to extract housing data for the West Broadway and Spence neighborhoods combined. 
Steps: 
  1. Open up the Winnipeg Community Map
  2. Turn on the Neighborhood Layer
  3. Zoom to downtown Winnipeg, to the West Broadway and Spence neighborhoods
  4. Click on the Proximity tool
  5. In the Find layer picklist (top of toolbox), choose the Census Housing 2016 layer
  6. In the Selected picklist (bottom of toolbox), choose the Neighborhood Boundaries layer. 
  7. Using the handpicker tool, click on West Broadway and then the Spence neighborhood.  They will turn red when selected properly. 
  8. Click on the Get Results button. 
  9. Click on the Generate Report button. 
Picture
Picture

Manitoba Collaborative Data Portal
A Collective Impact Project coordinated by the
Social Planning Council of Winnipeg

Search the Site


​Quick Links

About the MBCDP
Getting Started
​Frequently Asked Questions
Blog
Sign-up for Update
Contact Us
  • Home
  • Mapping + Dashboards
    • Demographic Dashboards
    • Web Mapping === >
      • Interactive Web Maps
      • Data Dictionary
      • Queriable Layers
      • User Manuals
      • Video Tutorials
    • WHR Client Lookup
    • Map Gallery
  • Knowledge Portals
    • Food and Nutrition Security
    • Transportation and Urban Design
    • Housing and Homelessness
    • Overdose and Drug Related Harms
    • Community Health Assessment 2019
  • Resources
    • Local Data Portals
    • National Data Portals
    • Training Resources
    • Manitoba Census Data Consortium === >
      • About
      • Private Access
    • Neighborhood Explorer Toolset
    • Update History
  • Help
    • About MbCDP
    • Getting Started
    • FAQs
    • Blog
    • Sign Up for Updates
    • Contact