Manitoba Collaborative Data Portal
  • Home
  • Mapping + Dashboards
    • Demographic Dashboards
    • Web Mapping === >
      • Interactive Web Maps
      • Data Dictionary
      • Queriable Layers
      • User Manuals
      • Video Tutorials
    • WHR Client Lookup
    • Map Gallery
  • Knowledge Portals
    • Food and Nutrition Security
    • Transportation and Urban Design
    • Housing and Homelessness
    • Overdose and Drug Related Harms
    • Community Health Assessment 2019
  • Resources
    • Local Data Portals
    • National Data Portals
    • Training Resources
    • Manitoba Census Data Consortium === >
      • About
      • Private Access
    • Neighborhood Explorer Toolset
    • Update History
  • Help
    • About MbCDP
    • Getting Started
    • FAQs
    • Blog
    • Sign Up for Updates
    • Contact

Housing Dashboard Instructions

Housing Dashboard Instructions

​Interactive Filtering: 
  • Dashboards are interactive and can be filtered by clicking on any of the chart objects.  For example, if you click on the the Someone Else's Place bar in the Where People stayed chart, the dashboard will refresh and portray data only for clients who stayed at someone else's place.    
  • Dashboards can be filtered of multiple attributes by holding down the Ctrl key and then clicking on multiple chart elements. 
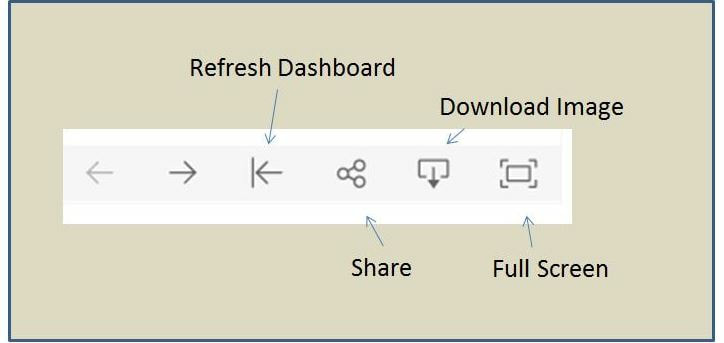
  • Dashboards can be refreshed to their beginning state (no attributes selected) by clicking on the refresh button (see graphic below). 
  • The population pyramid cannot be used to filter the dashboard.  If you want to filter by age or gender, click on the age/gender table. 
Exporting Images for Use in Reports:  Images can be exported using one of three methods: 
  • Download the dashboard as a png file:    Click on the download icon (see graphic below), and click on  Image. 
  • Download the dashboard as a pdf:    Click on the download icon, and then click on PDF
  • Using the Snipping Tool in Windows to snip the portion of the dashboard you want to use in a presentation.
Viewing in Full Screen:   The dashboard can be viewed in full screen by clicking on the Full Screen icon (see graphic below).  When in full screen, you can return to the original view by clicking the ESC button.  
Picture
Picture

Manitoba Collaborative Data Portal
A Collective Impact Project coordinated by the
Social Planning Council of Winnipeg

Search the Site


​Quick Links

About the MBCDP
Getting Started
​Frequently Asked Questions
Blog
Sign-up for Update
Contact Us
  • Home
  • Mapping + Dashboards
    • Demographic Dashboards
    • Web Mapping === >
      • Interactive Web Maps
      • Data Dictionary
      • Queriable Layers
      • User Manuals
      • Video Tutorials
    • WHR Client Lookup
    • Map Gallery
  • Knowledge Portals
    • Food and Nutrition Security
    • Transportation and Urban Design
    • Housing and Homelessness
    • Overdose and Drug Related Harms
    • Community Health Assessment 2019
  • Resources
    • Local Data Portals
    • National Data Portals
    • Training Resources
    • Manitoba Census Data Consortium === >
      • About
      • Private Access
    • Neighborhood Explorer Toolset
    • Update History
  • Help
    • About MbCDP
    • Getting Started
    • FAQs
    • Blog
    • Sign Up for Updates
    • Contact